A client at work recently asked to monitor a few services on AWS. Since I’m not an AWS expert, I decided to use this as an opportunity to learn and document the process. My goal with this article is to better understand how to set up monitoring and, hopefully, make it clearer for anyone else tackling a similar task.
To keep it brief, I’ll focus on creating alerts for the following scenarios:
- 90% usage of vCPU for spot EC2 instances
- 90% usage of DynamoDB Tables
Overview
When working with AWS there are a loooot of components that can come into play. For this task, the main services we’ll be using are:
- CloudWatch: as the name suggests, it watches over cloud resources and sends alerts when specified conditions are met.
- Lambda Functions: lightweight, serverless functions that can perform custom logic within the AWS environment.
- EventBridge: this service allows us to create schedules that trigger Lambda functions at specified times or events.
First Alert: 90% vCPU EC2
Monitoring CPU usage is a common practice, and AWS makes it relatively easy to set up alerts by exposing this metric directly—no need for a custom Lambda function to retrieve it.
Create the Alarm
- Open the CloudWatch console on AWS.
- Navigate to All alarms and click Create alarm.
- You’ll be prompted to choose a metric to monitor. Search for
vcpu, and you should see two results: one for On-Demand instances and one for Spot instances. - Select the metric for Spot instances by ticking the corresponding box.
Converting the Metric to a Percentage
To calculate the percentage of vCPU usage, follow these steps:
Click Graphed metrics (1) located below the graph. This will open the metrics editor view.
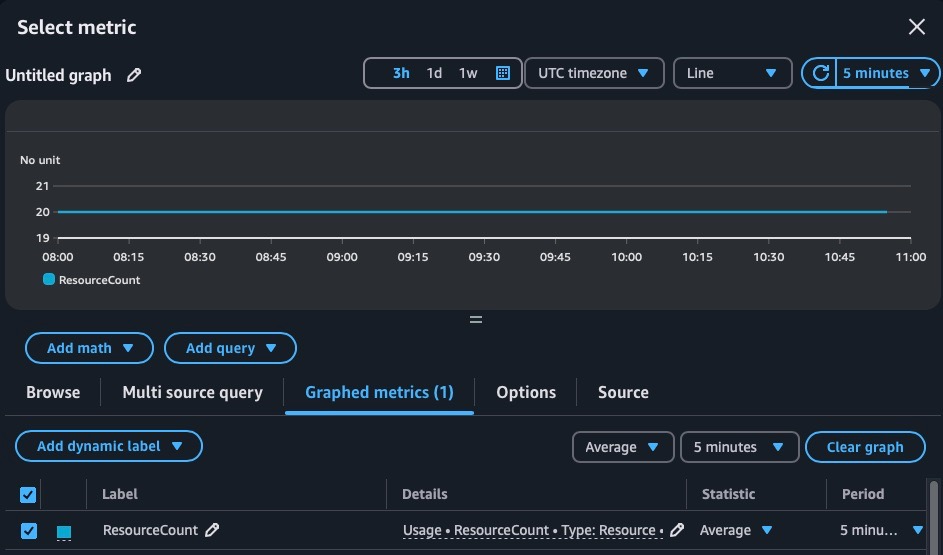
Pro Tip: Want dark mode in AWS Console? Click the gear icon at the top right of the page to enable it.
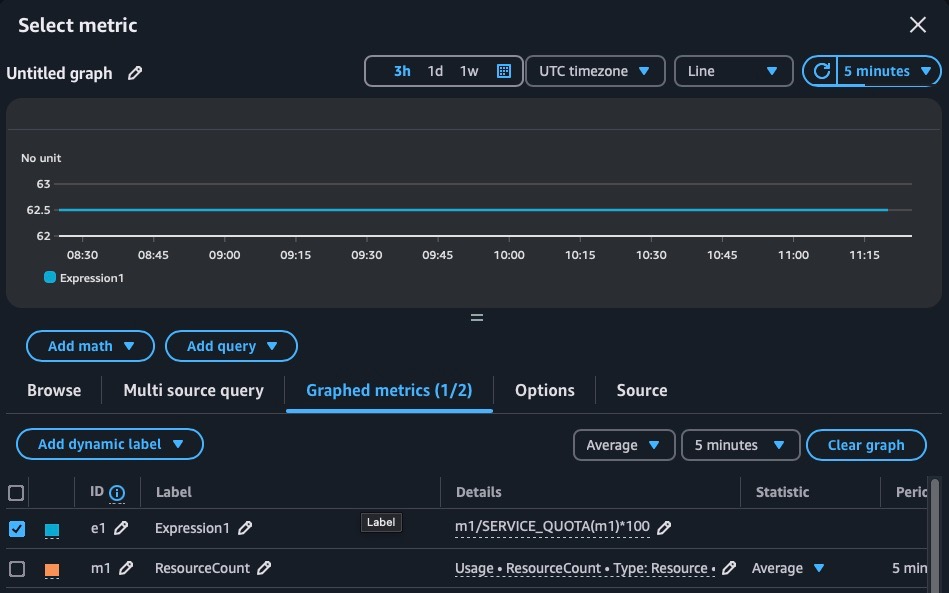
Click Add math → All functions → SERVICE_QUOTA.
- This adds a line to the graph representing the Service Quota for the selected metric (i.e., the maximum number of vCPUs your account can request).
Adjust the settings:
Change the Statistic field from “Average” to Maximum.
Modify the “Details” field for the Service Quota expression by entering:
m1/SERVICE_QUOTA(m1)*100
This formula calculates the percentage usage of the selected metric.
To clean up the view, untick the metric labeled ResourceCount to display only the percentage.
Finally, click Select metric at the bottom.
Set Alarm Trigger
All that’s left to do is specify a threshold value—in this case, 90—that will trigger the alarm. Then, follow these steps:
Click Next and choose Create new topic to specify an email address to notify when the alarm is triggered.
- Enter a name for the new topic.
- Provide the email address to receive notifications.
Note: A confirmation email will be sent to the specified address, with a link to complete the subscription to the topic.
Click Next and give the alarm a meaningful name.
Click Next again, and finally, click Create alarm to complete the setup.
Second Alert: 90% DynamoDB Tables
Working as a consultant, you sometimes get peculiar requests from customers. For example, setting up an alert to monitor how many DynamoDB tables are in use and trigger an alarm when usage exceeds 90%.
Unlike the first alert, this time we cannot use the SERVICE_QUOTA function to
get the limit of DynamoDB tables that the AWS account can instantiate. Attempting
to do so results in an error:
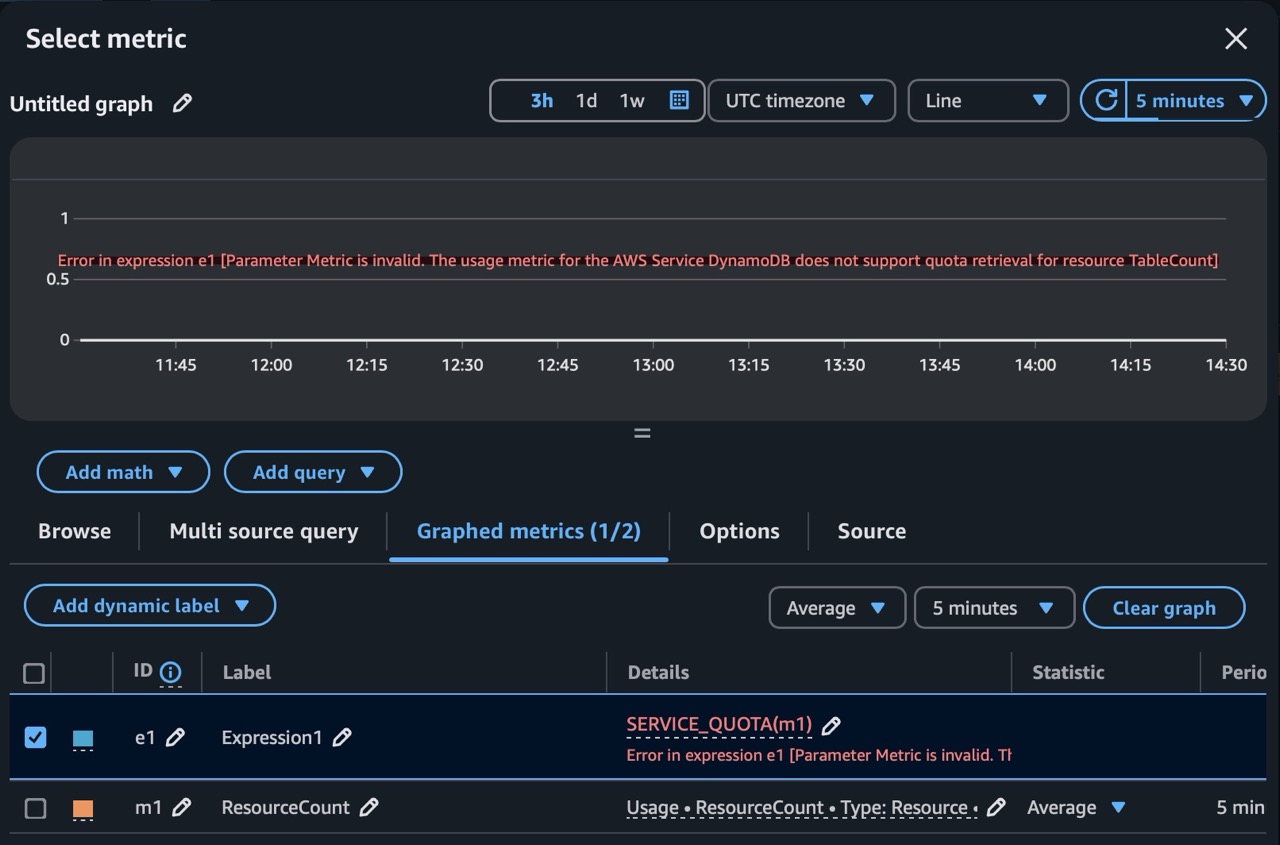
To tackle this issue, we can create our own custom metric within CloudWatch! We can achieve this by using a simple Lambda function that publishes the metric periodically, once a day. Let’s go over the entire process.
Create IAM Policy
Upon creation, Lambda functions are assigned a newly created IAM Role by default, with a generic IAM Policy crafted for typical Lambda use cases. Since our Lambda will need to read Service Quotas and publish metrics to CloudWatch, we’ll need to grant it the necessary permissions. This can be achieved using IAM Policies, which specify what actions can be performed and can be attached to the who (the IAM Role).
On the AWS console, navigate to IAM, click on Policies, and then select Create policy.
Once in the policy editor, select JSON instead of Visual and enter the following:
{
  "Version": "2012-10-17",
  "Statement": [
    {
      "Sid": "VisualEditor0",
      "Effect": "Allow",
      "Action": [
        "cloudwatch:PutMetricData",
        "servicequotas:GetServiceQuota",
        "autoscaling:DescribeAccountLimits",
        "cloudformation:DescribeAccountLimits",
        "dynamodb:DescribeLimits",
        "elasticloadbalancing:DescribeAccountLimits",
        "iam:GetAccountSummary",
        "kinesis:DescribeLimits",
        "route53:GetAccountLimit",
        "rds:DescribeAccountAttributes"
      ],
      "Resource": "*"
    }
  ]
}
This json gives permissions to read Service Quotas and write metrics to CloudWatch.
Click Next, assign the policy a meaningful name, and create it.
Now that we have our permissions setup we can move on to creating the lambda function.
Create Lambda
From the Lambda console on AWS, click on Create function, give it a name, and pick Python as the runtime. Leave the rest as default and create the function.
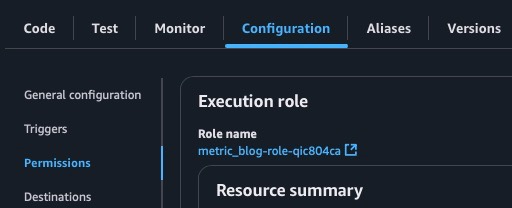
In the Configuration tab, under Permissions, there is a link to the newly created IAM Role for this Lambda. Click on it to edit the role and add the previously created policy (Add permissions → Attach policies → Pick your policy).
Now, return to the Code editor tab. For the Lambda function, insert the following code:
"""
AWS Lambda to retrieve service quotas
"""

from datetime import datetime

import boto3

# Initialize clients to interact with CloudWatch and Service Quotas
# Docs(cw): https://boto3.amazonaws.com/v1/documentation/api/latest/reference/services/cloudwatch.html
# Docs(sq): https://boto3.amazonaws.com/v1/documentation/api/latest/reference/services/service-quotas.html
client_cw = boto3.client("cloudwatch")
client_sq = boto3.client("service-quotas")


def lambda_handler(event, context):
    """
    Retrieve service quota for a specific service and publish its value as a
    Custom Metric on CloudWatch.
    """
    # List ServiceCodes: `aws service-quotas list-services`
    service_code = "dynamodb"
    # List QuotaCodes of a service:
    # `aws service-quotas list-service-quotas --service-code dynamodb`
    quota_code = "L-F98FE922"
    try:
        response = client_sq.get_service_quota(
            ServiceCode=service_code, QuotaCode=quota_code
        )
        sq = response["Quota"]["Value"]
        print(f"Service Quota: {sq}")
        namespace = "Custom Metrics"
        metric_name = "MaxDynamoDBTables"
        # Publish Service Quota as a Custom Metric on CloudWatch
        client_cw.put_metric_data(
            Namespace=namespace,
            MetricData=[
                {
                    "MetricName": metric_name,
                    "StatisticValues": {
                        "SampleCount": 1,
                        "Sum": sq,
                        "Minimum": sq,
                        "Maximum": sq,
                    },
                    "Unit": "Count",
                    "Timestamp": datetime.now(),
                }
            ],
        )
        return {"statusCode": 200, "body": "Metric successfully sent to CloudWatch!"}
    except Exception as e:
        err = f"Error: {str(e)}"
        print(err)
        return {"statusCode": 500, "body": err}
The parameters you need to tweak in the Python script are:
- service_code: The service code for the quota (e.g., dynamodb).
- quota_code: The code identifying the quota.
- namespace: The namespace the custom metric will belong to.
- metric_name: The name of the metric.
Finally, click on Deploy, then Test. Create a new test event and invoke the function. If everything was configured correctly, you should see a message stating that the metric was successfully sent to CloudWatch.
To verify, inspect CloudWatch’s metrics in the AWS console. You should find your new metric under the namespace you specified!
Schedule Lambda Execution
Now that we have a working Lambda that publishes otherwise unavailable metrics to CloudWatch, we need to schedule it to run periodically—once a day, for example— to ensure our metric stays up to date. To achieve this, we use EventBridge schedules.
- From the AWS console, navigate to EventBridge Scheduler and click on Create schedule.
- Give the schedule a meaningful name. Select Recurring schedule as the
schedule pattern and assign a cron expression like
0 1 * * ? *, which triggers the Lambda every day at 1 a.m. - Turn off Flexible time window, then click Next.
- Choose AWS Lambda as the target detail and select the previously created Lambda from the dropdown list. Click Next.
- Under Action after schedule completion, select None from the dropdown. Click Next and then Create schedule.
Create Alarm
To create the alarm, follow the previous steps with a few minor differences.
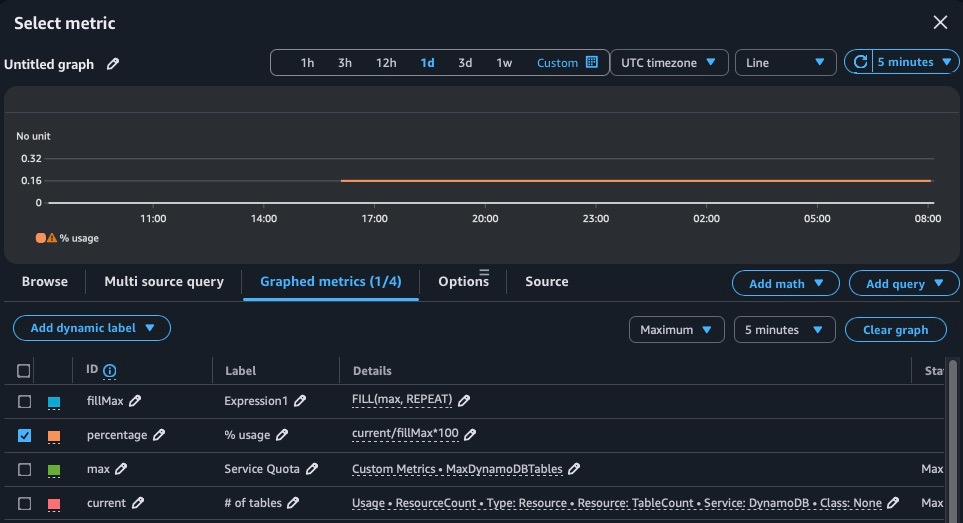
When selecting metrics for the alarm, pick the new metric we created with the Lambda and the table count for DynamoDB under the Usage > By AWS Resource namespace.
You’ll notice the custom metric shows only a single data point (or a few, depending on how many times you tested the Lambda). To get a continuous line, select Add math and use the FILL function. Provide the metric and REPEAT as arguments.
Copy one of the metrics using the dedicated button, then change its details as shown in the picture below. This will display the percentage usage of DynamoDB tables!
Wrapping it up
In this guide, we covered the steps to monitor AWS resources by creating custom CloudWatch metrics and alarms. Here’s a quick recap:
CPU Usage Alert for EC2 Spot Instances:
- Used AWS’s built-in Service Quotas to monitor vCPU usage.
- Configured an alarm to trigger when usage exceeded 90%.
DynamoDB Table Usage Alert:
- Created a Lambda function to retrieve and publish custom metrics to CloudWatch.
- Scheduled the Lambda to run daily using EventBridge Scheduler.
- Set up a CloudWatch alarm to monitor DynamoDB table usage and trigger alerts when exceeding 90%.
With these tools and techniques, you can monitor key AWS resources effectively and respond proactively to resource constraints. For future improvements, consider exploring more CloudWatch features or expanding your monitoring setup to include other AWS services.
